Disclaimer: This is not an official release and is only meant for development and feed-back purposes
Caracteristics of this version
The idea of this version of the model is to reproduce as exactly as possible the assumptions made in the subnational Forest Reference Emission Levels (FREL/FRL) submitted by Chile to the UNFCCC
The information to run this model comes from the layers of the cadastre of native forest (land use map) from Los Rios region, that has registries from the years 1997, 2006, 2013 and 2017. The biomass parameters come from the National Forest Inventory.
Ages and growth curves
To reproduce the mean regional volume of existence used in the FREL/FRL for Los Rios Region (375.29 m3/ha). In consequence, a single curve was used for all forest types, starting with zero and reaching the mean regional volume at 100 years, using an increment of 3.7529 m3/ha/year.
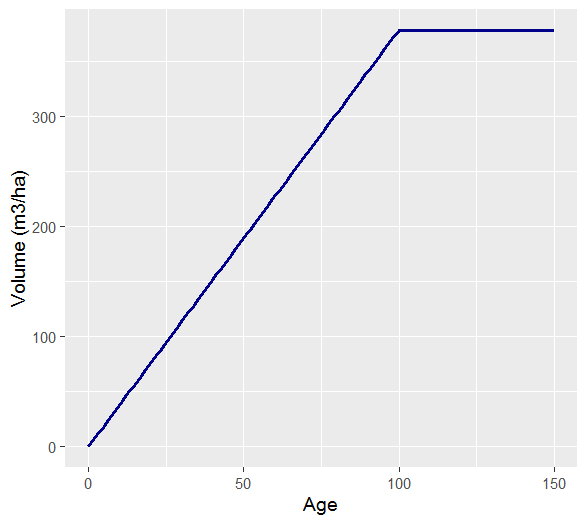
The initial age of the forest registered in the 1997 land use map is considered 100, to consider a single value of volume (or carbon) at the moment of a deforestation event.
For the arborescent shrubland, a similar approach was used, considering a maximum volume of 49.25 m3/ha (this is not the real value, it was calculated to use the same root parameters as in the normal forest, it will be changed in the future)
Disturbances
To get the disturbance data, land use changes were detected between consecutive dates of the cadastre (official land use map of Chile), following the rules described in the FREL/FRL. The disturbance polygons were randomly distributed between the years in between the two cadastre maps (those included). For example, if a deforestation was detected in 2006, the year of the disturbance was determined choosing a random number between 1997 and 2006.
In this run, we are only including the Afforestation, Deforestation and Substitution activities, for the latter two we are using a single custom disturbance matrix for their representation, The idea is to transfer all the DOM and Biomass pools to CO2, just as in the FREL/FRL:
| Source | Sink | Proportion |
|---|---|---|
| SoftwoodMerch | CO2 | 1 |
| SoftwoodFoliage | CO2 | 1 |
| SoftwoodOther | CO2 | 1 |
| SoftwoodCoarseRoots | CO2 | 1 |
| SoftwoodFineRoots | CO2 | 1 |
| HardwoodMerch | CO2 | 1 |
| HardwoodFoliage | CO2 | 1 |
| HardwoodOther | CO2 | 1 |
| HardwoodCoarseRoots | CO2 | 1 |
| HardwoodFineRoots | CO2 | 1 |
| AboveGroundVeryFastSoil | AboveGroundVeryFastSoil | 1 |
| BelowGroundVeryFastSoil | BelowGroundVeryFastSoil | 1 |
| AboveGroundFastSoil | AboveGroundFastSoil | 1 |
| BelowGroundFastSoil | BelowGroundFastSoil | 1 |
| MediumSoil | MediumSoil | 1 |
| AboveGroundSlowSoil | AboveGroundSlowSoil | 1 |
| BelowGroundSlowSoil | BelowGroundSlowSoil | 1 |
| SoftwoodStemSnag | CO2 | 1 |
| SoftwoodBranchSnag | CO2 | 1 |
| HardwoodStemSnag | CO2 | 1 |
| HardwoodBranchSnag | CO2 | 1 |
| BlackCarbon | BlackCarbon | 1 |
| Peat | Peat | 1 |
The afforestation activity corresponds to new forests that are detected in the cadaster maps, these new forests grow with and Annual Periodic Increment that is determined by the Forest type and Structure of the new forest
Vol to bio factors
To reflect the characteristics of the FREL/FRL emission factors, the vol to bio factors were modified, creating a single “Generic Chile” specie. The conversion from merchantable volume to biomass consist in a multiplication by 0.875. Considering a expansion factor of 1.75 and a density of the wood of 0.5. Given those considerations, the parameters were adjusted following the guidelines described in Boudewyn et al (2007):
| Volume to biomass factor | Value |
|---|---|
| a | 0.875 |
| b | 1 |
| a_nonmerch | 0 |
| b_nonmerch | 1 |
| k_nonmerch | 1 |
| cap_nonmerch | 1 |
| a_sap | 0 |
| b_sap | 1 |
| k_sap | 1 |
| cap_sap | 1 |
| a1 | -9999999 |
| a2 | -9999999 |
| a3 | -9999999 |
| b1 | -9999999 |
| b2 | -9999999 |
| b3 | -9999999 |
| c1 | -9999999 |
| c2 | -9999999 |
| c3 | -9999999 |
| min_volume | 0.1 |
| max_volume | 1000 |
| low_stemwood_pop | 0.50249 |
| high_stemwood_pop | 0.70391 |
| low_stembark_prop | 0.09492 |
| high_stembark_prop | 0.11402 |
| low_branches_pop | 0.26098 |
| high_branches_pop | 0.14622 |
| low_foliage_prop | 0.1416 |
| high_foliage_prop | 0.03585 |
- The nonmerchantable factor was set to 1, so in the end the nonmerchantable trees were not considered.
- The sapling factor was also set to 1, so sapling-sized trees were also not considered.
- Very low values were chosen for the parameters to determine branches, bark and foliage, giving them a biomass almost equal to zero (the expansion factor of the Chilean forest includes them)
- The parameters to determine the last proportions of total tree biomass found in stem wood, stem bark, branch and foliage for live trees of all sizes were based on the Red Alder species.
Root parameters
The root-stem ratio is 0.2869, so the root parameters were modified as followed:
| Root_parameter | Value |
|---|---|
| hw_a | 0.2869 |
| sw_a | 0.2869 |
| hw_b | 1 |
| frp_a | 0.072 |
| frp_b | 0.354 |
| frp_c | -0.060211946 |
Some assumptions and procedures:
- Only native forest was included, forest plantations are considered to be nonforest (zero carbon), this is for REDD+ accounting purposes
- The classifiers used for the mapping of the forests were “Forest type”, “Structure” and “Origin”
- The arborescent shrubland is considered a forest type
- The resolution used in the tiler was 0.001 degrees
- The disturbances take place in the same moment as the land use map is released (in this case the years 2006, 2013 and 2017), so we can see some spikes
Results
The results of the version showed very similar biomass emissions in comparison with the FREL/FRL, when looking at the emissions for the years in the period 2001-2013:
- CO2 emissions coming from biomass for Deforestation: 502065 tCO2/year (+3.92% in comparison with the FREL)
- CO2 emissions coming from biomass for Substitution: 573868 tCO2/year (+0.50% in comparison with the FREL)
Although the total emissions are underestimated, this is because the DOM values are much lower (-80% less) than the values used in the FREL/FRL
Power BI Dashboard
Next steps
- Include a second set of root parameters for the arborescent shrubland
- Include degradation and enhancement of forest carbon stocks disturbances
- Include custom DOM and SOC values